Trending: Here are some Business Statistics and Trends to know

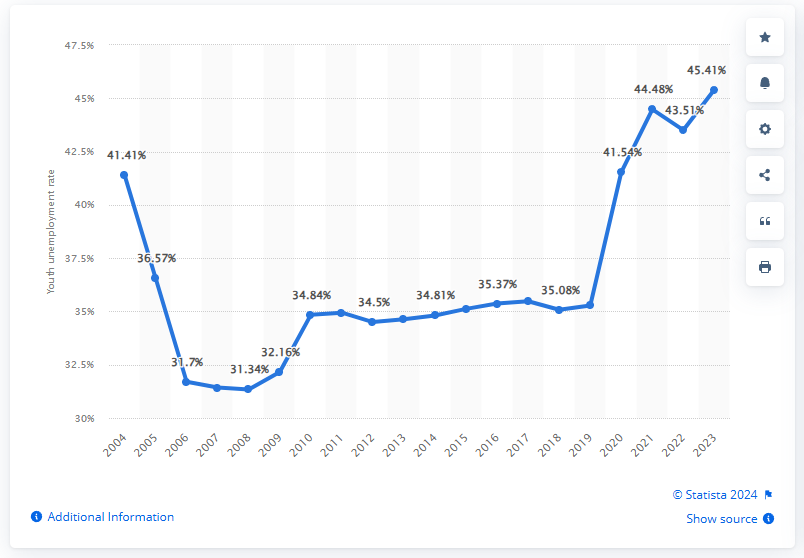
This image features a line graph that depicts the youth unemployment rate in botswana over a period spanning two decades from 2004 to 2023 Starting at 41 41 in 2004 the graph indicates a downward trend reaching its lowest point of 31 34 in 2008 Between 2009 and 2018 the unemployment rate fluctuated slightly but remained relatively steady averaging around 34 35 However the years following 2019 marked a concerning upward trajectory with youth unemployment sharply rising to 45 41 by 2023 This increase reflects economic challenges and underscores the need for targeted youth employment strategies